Part of the reason I want to have the monitoring stack installed, is to install the Internet Pi by Jeff Geerling. Internet Pi was managed via Docker Compose and deployed using Ansible. For me, I want it on my kubernetes cluster.

Internet Pi comes with quite a lot of stuffs:

  • nginx-proxy: as ingress, which I don’t need (I have metallb)
  • pi-hole: I already have it
  • shelly plug monitoring: tracks shelly plug power usage. No need for me
  • air gradient monitoring: nope
  • starlink monitoring: nope
  • prometheus: already installed by kube-prometheus
  • grafana: already installed by kube-prometheus, but I need Jeff’s dashboard
  • node exporter: already installed by kube-prometheus
  • blackbox exporter: for the metrics of probing target endpoints, already installed by kube-prometheus, but need to setup probe
  • speedtest exporter: for speed test metrics

Import Grafana Dashboard

Jeff has already provided the rendered dashboard at here, I just need to import it in the values section of the example.jsonnet used in previous blog.

 1
 2
 3
 4
 5
 6
 7
 8
 9
10
11
    values+:: {
      common+: {
        namespace: 'monitoring',
      },
      grafana+: {
        dashboards+:: {
          'internet-connection.json': (import 'grafana-dashboards/internet-connection.json'),
        },
        plugins: ['flant-statusmap-panel'],
      },
    },

Note that I also added a plugin that required in the dashboard. Then build and apply the change.

Create Probe Custom Resource for Blackbox Exporter

Prometheus Operator uses Probe custom resource to configure Prometheus with Blackbox Exporter. My use case is simple:

 1
 2
 3
 4
 5
 6
 7
 8
 9
10
11
12
13
14
15
16
kind: Probe
apiVersion: monitoring.coreos.com/v1
metadata:
  name: ping-probe
  namespace: monitoring
spec:
  interval: 5s
  module: http_2xx
  prober:
    url: blackbox-exporter.monitoring.svc.cluster.local:19115
  targets:
    staticConfig:
      static:
      - http://google.com
      - https://github.com
      - https://anakinfoxe.com

Install Speedtest Exporter

Firstly, deploy a deployment and service for it.

 1
 2
 3
 4
 5
 6
 7
 8
 9
10
11
12
13
14
15
16
17
18
19
20
21
22
23
24
25
26
27
28
29
30
31
32
33
34
35
36
37
apiVersion: apps/v1
kind: Deployment
metadata:
  name: speedtest-exporter
  namespace: monitoring
spec:
  replicas: 1
  selector:
    matchLabels:
      app: speedtest-exporter
  template:
    metadata:
      labels:
        app: speedtest-exporter
    spec:
      containers:
      - name: speedtest-exporter
        image: miguelndecarvalho/speedtest-exporter:v3.5.3
        ports:
        - name: metrics
          containerPort: 9798
---
apiVersion: v1
kind: Service
metadata:
  name: speedtest-exporter
  namespace: monitoring
  labels: # must match with ServiceMonitor
    app: speedtest-exporter
spec:
  selector:
    app: speedtest-exporter
  ports:
  - port: 9798
    targetPort: metrics
    protocol: TCP
    name: metrics

Then deploy a ServiceMonitor custom resource for Prometheus service discovery so it knows to scrape this service.

 1
 2
 3
 4
 5
 6
 7
 8
 9
10
11
12
13
14
15
16
17
apiVersion: monitoring.coreos.com/v1
kind: ServiceMonitor
metadata:
  name: speedtest-exporter
  namespace: monitoring
spec:
  selector:
    matchLabels:
      app: speedtest-exporter
  namespaceSelector:
    matchNames:
    - monitoring
  endpoints:
  - port: metrics
    interval: 60m
    scrapeTimeout: 60s
    path: /metrics

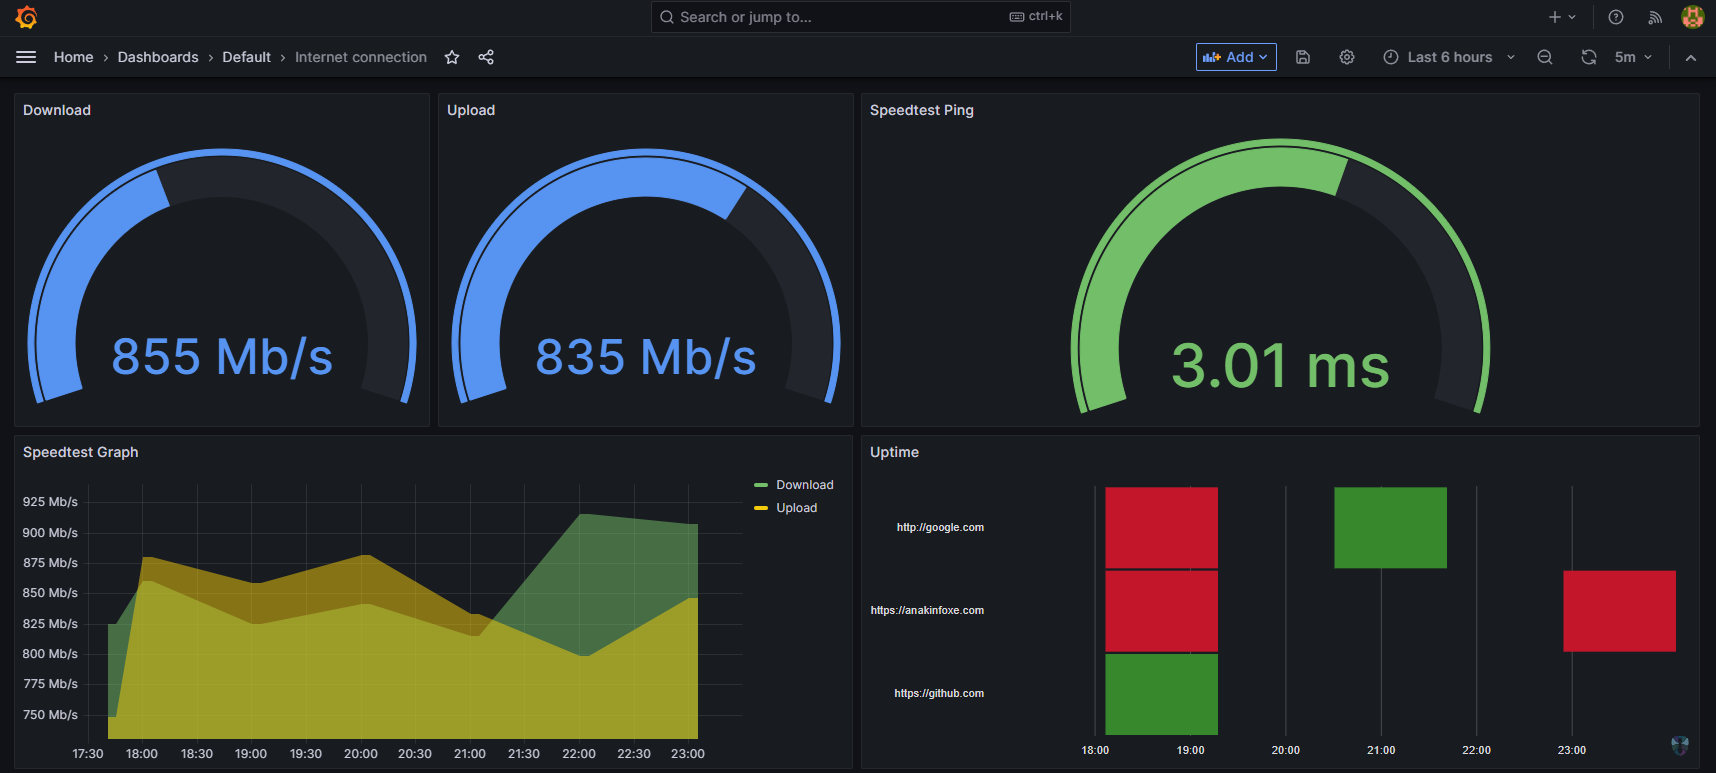
That’s it. Once all of these steps are done, both blackbox probe and speedtest exporter should be seen in Prometheus /targets (e.g. https://<local-ip>:9090/targets). And later the metrics should show up in the Internet Connection dashboard!