Why?

kube-prometheus is an open-source project created by the maintainers of Prometheus Operator. It provides a set of configuration files and resource definitions for deploying a complete Prometheus monitoring stack on Kubernetes.

kube-prometheus utilizes Prometheus Operator to set up and manage the following components:

  • Prometheus: Used for collecting and storing metric data.
  • Alertmanager: Used for handling alerts.
  • Grafana: Used for visualizing metric data.
  • Prometheus node-exporter: Used for collecting metrics from k8s nodes.
  • kube-state-metrics: Used for collecting metrics from the k8s API server.
  • Prometheus Adapter: Used for exposing Prometheus metrics to the k8s custom metrics API.

Pros:

  • Complete solution: It provides everything needed to establish a comprehensive monitoring infrastructure on Kubernetes.
  • Out-of-the-box functionality: Preconfigured alerts and dashboards allow you to quickly start monitoring your cluster and applications without the need to configure everything from scratch.
  • Customizable: Although kube-prometheus provides a complete starting point, you can freely adjust and extend it according to your specific requirements.
  • Community support: As part of the Prometheus Operator ecosystem, kube-prometheus benefits from an active community that continuously contributes new features, bug fixes, and improvements.

Cons:

  1. Complexity: kube-prometheus introduces a considerable number of components and configurations. Understanding and managing these require some time and effort.
  2. Resource overhead: Running a full monitoring stack can consume a significant amount of resources, however does not seem to be the troubling for my little k3s cluster
  3. Upgrade management: Over time, managing upgrades of the kube-prometheus components can become challenging.

Prepare kube-prometheus Library

The prerequisites specified that kubelet configuration must contains following flags:

  • --authentication-token-webhook=true
  • --authorization-mode=Webhook From what I checked, the k3s agent from the latest version (1.22 and above) already have them included, so we should be good.

kube-prometheus provided the installing guide for anyone who wants to customize the configuration:

1
2
3
4
5
6
7
8
$ mkdir my-kube-prometheus; cd my-kube-prometheus
$ jb init  # Creates the initial/empty `jsonnetfile.json`
# Install the kube-prometheus dependency
$ jb install github.com/prometheus-operator/kube-prometheus/jsonnet/kube-prometheus@<release-version> # Creates `vendor/` & `jsonnetfile.lock.json`, and fills in `jsonnetfile.json`

$ wget https://raw.githubusercontent.com/prometheus-operator/kube-prometheus/main/example.jsonnet -O example.jsonnet
$ wget https://raw.githubusercontent.com/prometheus-operator/kube-prometheus/main/build.sh -O build.sh
$ chmod +x build.sh

Note that when jb install github.com/prometheus-operator/kube-prometheus/jsonnet/kube-prometheus@<release-version> choose the release that’s compatible with the cluster version

Customization for Metallb

I have deployed Metallb for the services on my k3s cluster which works great, and I want to use it to expose Grafana, Prometheus and Alertmanager, so I can access them easily without needing to port-forward lol

With kube-prometheus, it’s pretty simple, just override the service config:

  1
  2
  3
  4
  5
  6
  7
  8
  9
 10
 11
 12
 13
 14
 15
 16
 17
 18
 19
 20
 21
 22
 23
 24
 25
 26
 27
 28
 29
 30
 31
 32
 33
 34
 35
 36
 37
 38
 39
 40
 41
 42
 43
 44
 45
 46
 47
 48
 49
 50
 51
 52
 53
 54
 55
 56
 57
 58
 59
 60
 61
 62
 63
 64
 65
 66
 67
 68
 69
 70
 71
 72
 73
 74
 75
 76
 77
 78
 79
 80
 81
 82
 83
 84
 85
 86
 87
 88
 89
 90
 91
 92
 93
 94
 95
 96
 97
 98
 99
100
101
102
103
104
105
106
107
108
109
110
111
112
113
114
115
116
117
118
119
120
121
122
123
124
125
126
127
local kp =
  (import 'kube-prometheus/main.libsonnet') +
  // Uncomment the following imports to enable its patches
  // (import 'kube-prometheus/addons/anti-affinity.libsonnet') +
  // (import 'kube-prometheus/addons/managed-cluster.libsonnet') +
  // (import 'kube-prometheus/addons/node-ports.libsonnet') +
  // (import 'kube-prometheus/addons/static-etcd.libsonnet') +
  // (import 'kube-prometheus/addons/custom-metrics.libsonnet') +
  // (import 'kube-prometheus/addons/external-metrics.libsonnet') +
  // (import 'kube-prometheus/addons/pyrra.libsonnet') +
  {
    values+:: {
      common+: {
        namespace: 'monitoring',
      },
    },
    grafana+:: {
      service+: {
        metadata+: {
          annotations+: {
            'metallb.universe.tf/allow-shared-ip': 'grafana',
          },
        },
        spec+: {
          type: 'LoadBalancer',
          loadBalancerIP: '192.168.10.247',
          ports: [
            {
              name: 'grafana-tcp',
              protocol: 'TCP',
              port: 3000,
              targetPort: 'http',
            },
          ],
        },
      },
      networkPolicy+: {
        spec+: {
          ingress: [{}],  // allow all
        },
      },
    },
    prometheus+:: {
      service+: {
        metadata+: {
          annotations+: {
            'metallb.universe.tf/allow-shared-ip': 'prometheus',
          },
        },
        spec+: {
          type: 'LoadBalancer',
          loadBalancerIP: '192.168.10.246',
          ports: [
            {
              name: 'web-tcp',
              protocol: 'TCP',
              port: 9090,
              targetPort: 'web',
            },
            {
              name: 'reloader-web-tcp',
              protocol: 'TCP',
              port: 8080,
              targetPort: 'reloader-web',
            },
          ],
        },
      },
      networkPolicy+: {
        spec+: {
          ingress: [{}],  // allow all
        },
      },
    },
    alertmanager+:: {
      service+: {
        metadata+: {
          annotations+: {
            'metallb.universe.tf/allow-shared-ip': 'alertmanager',
          },
        },
        spec+: {
          type: 'LoadBalancer',
          loadBalancerIP: '192.168.10.245',
          ports: [
            {
              name: 'web-tcp',
              protocol: 'TCP',
              port: 9093,
              targetPort: 'web',
            },
            {
              name: 'reloader-web-tcp',
              protocol: 'TCP',
              port: 8080,
              targetPort: 'reloader-web',
            },
          ],
        },
      },
      networkPolicy+: {
        spec+: {
          ingress: [{}],  // allow all
        },
      },
    },
  };

{ 'setup/0namespace-namespace': kp.kubePrometheus.namespace } +
{
  ['setup/prometheus-operator-' + name]: kp.prometheusOperator[name]
  for name in std.filter((function(name) name != 'serviceMonitor' && name != 'prometheusRule'), std.objectFields(kp.prometheusOperator))
} +
// { 'setup/pyrra-slo-CustomResourceDefinition': kp.pyrra.crd } +
// serviceMonitor and prometheusRule are separated so that they can be created after the CRDs are ready
{ 'prometheus-operator-serviceMonitor': kp.prometheusOperator.serviceMonitor } +
{ 'prometheus-operator-prometheusRule': kp.prometheusOperator.prometheusRule } +
{ 'kube-prometheus-prometheusRule': kp.kubePrometheus.prometheusRule } +
{ ['alertmanager-' + name]: kp.alertmanager[name] for name in std.objectFields(kp.alertmanager) } +
{ ['blackbox-exporter-' + name]: kp.blackboxExporter[name] for name in std.objectFields(kp.blackboxExporter) } +
{ ['grafana-' + name]: kp.grafana[name] for name in std.objectFields(kp.grafana) } +
// { ['pyrra-' + name]: kp.pyrra[name] for name in std.objectFields(kp.pyrra) if name != 'crd' } +
{ ['kube-state-metrics-' + name]: kp.kubeStateMetrics[name] for name in std.objectFields(kp.kubeStateMetrics) } +
{ ['kubernetes-' + name]: kp.kubernetesControlPlane[name] for name in std.objectFields(kp.kubernetesControlPlane) }
{ ['node-exporter-' + name]: kp.nodeExporter[name] for name in std.objectFields(kp.nodeExporter) } +
{ ['prometheus-' + name]: kp.prometheus[name] for name in std.objectFields(kp.prometheus) } +
{ ['prometheus-adapter-' + name]: kp.prometheusAdapter[name] for name in std.objectFields(kp.prometheusAdapter) }

Note that I also override NetworkPolicy for them to allow all ingress traffic, otherwise the default config only allows Prometheus to access them. Technically I should fine grain this config, but since everything runs in my LAN which has no exposure to Internet, I think it should be fine.

Build and Install

Run ./build.sh in the folder (e.g. my-kube-prometheus) will generate all the manifests in manifests folder. Then just install with kubectl

1
2
$ kubectl apply --server-side -f manifests/setup
$ kubectl apply -f manifests/

That’s it.

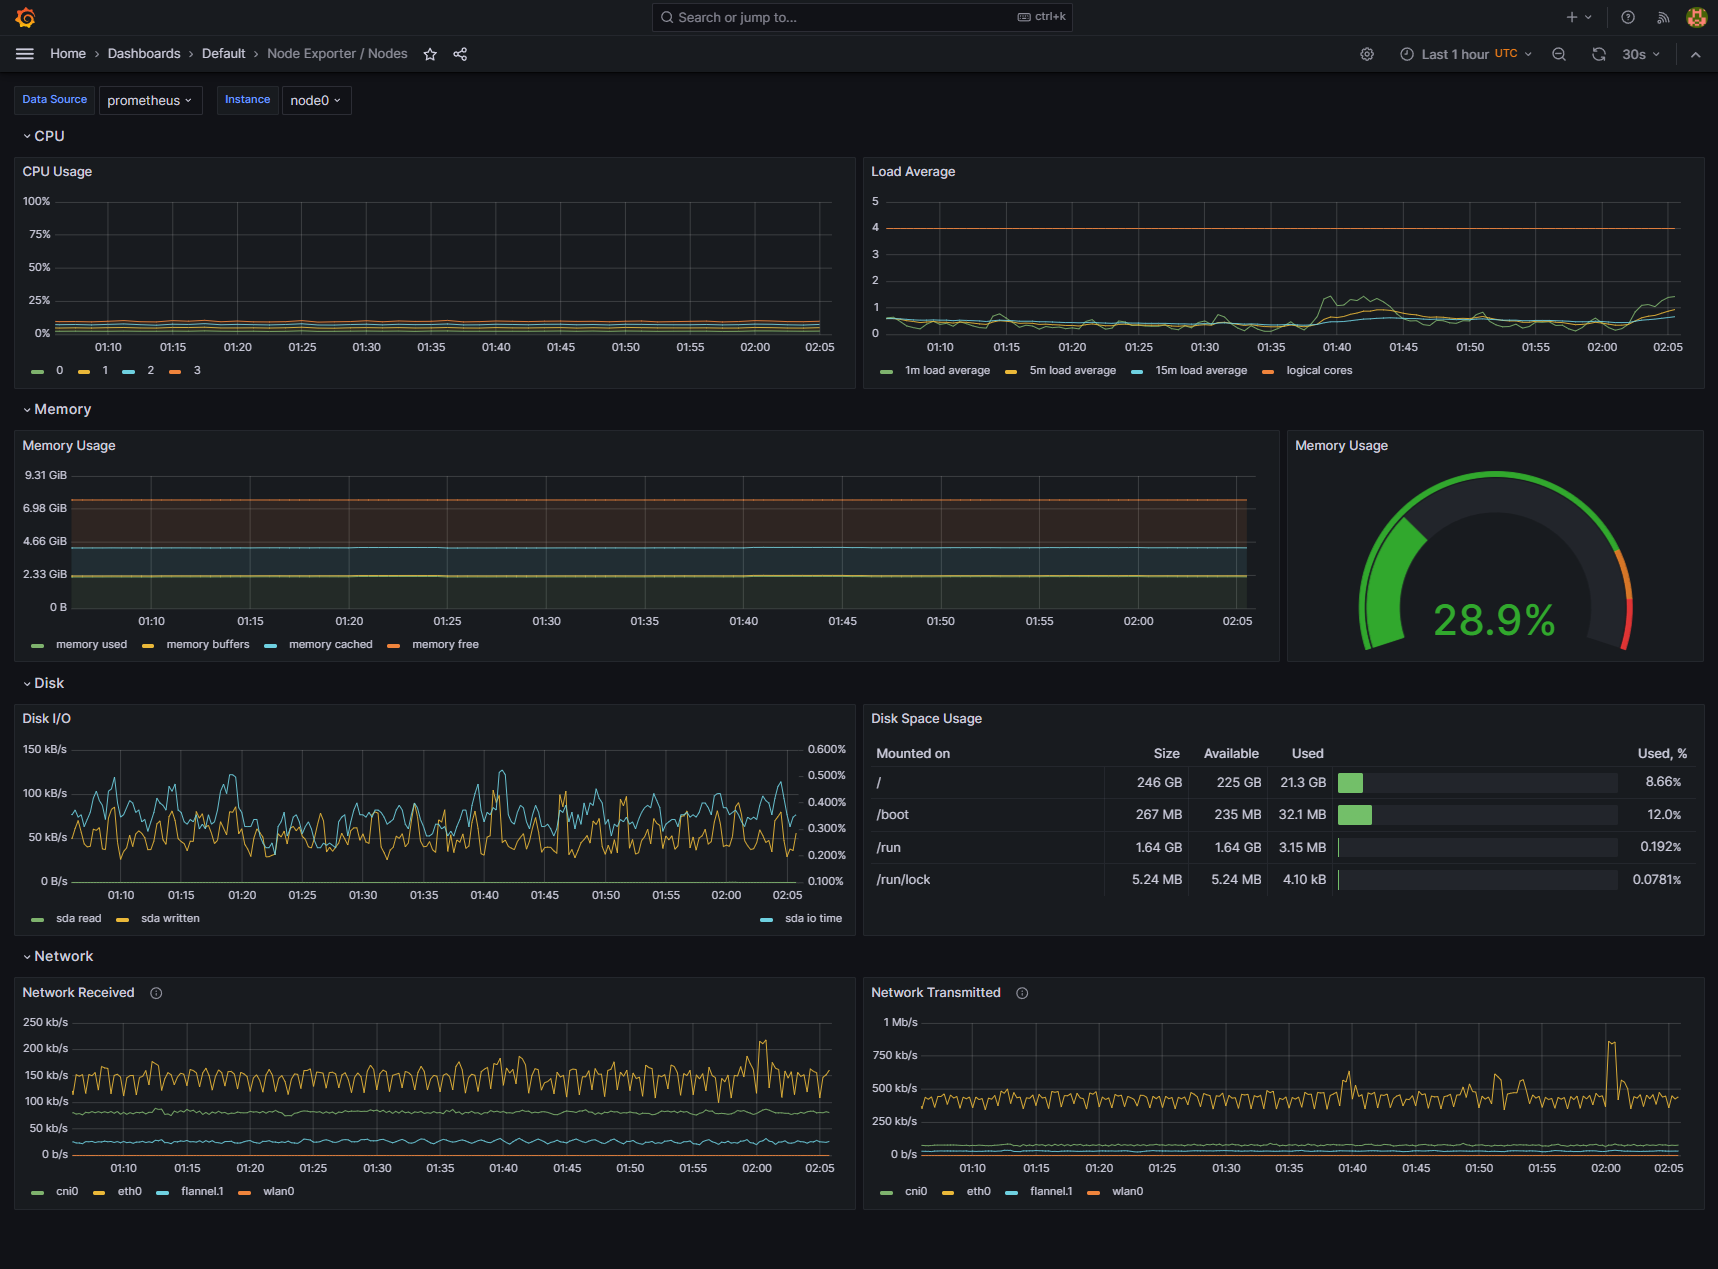
Node Exporter